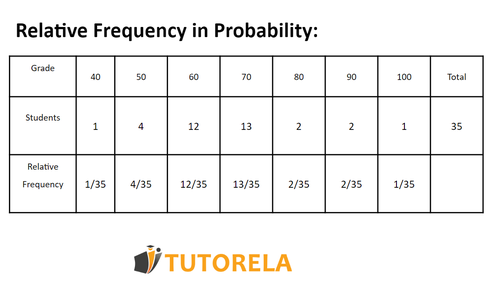
Relative Frequency in Probability
The relative frequency in probability represents the share of a certain object in the total number of objects in the set in question. In other words, Relative Frequency is a way of estimating probability based on past events. It is calculated by dividing the frequency of an event (how many times it happened) by the total number of trials or observations. For example, if you flip a coin 100 times and get 45 heads, the relative frequency of getting heads is . Relative frequency provides a practical approach to understanding probability, especially in experiments or real-life scenarios where actual outcomes can be measured, helping make predictions and decisions based on observed data.
Calculating Relative Frequency
Relative frequency is the ratio of the frequency of an event to the total number of trials. Calculated as:
Practical Use:
Relative frequency provides an empirical approach to probability by using observed data. For example, tracking how often it rains over many days helps predict future rain likelihood.


