A value table is the "preparatory work" that we are often asked to do before producing a graphical representation. Therefore, it is an inseparable part of the subject of graphs in general and the topic of functions in particular.
Value Table
What is a Value Table?
A value table is actually a database, on which a discrete or continuous graph is based.
The data table lists the corresponding value of for each .
The value table allows you to project and draw the graph conveniently and efficiently.
Below is an example of a value table for the function

Based on this value table, the following linear function can be plotted:
Test yourself on table of values!
Find a y when \( x=2 \)
\( y=5x \)
Quadratic Graph
Value Table
Before attempting to plot a graph, we should prepare a table of values. This is a table that will contain all the data that need to appear on the graph, and it will be very helpful in drawing it. Before plotting any graph (for example, of a constant function), it is recommended to prepare a table of values. Now let's understand how to do this.
Suppose we want to plot the graph of a linear function
Maybe later you can draw this function by heart, but even if it's not completely correct. That's exactly why we'll use the table of values.
First, we'll draw the table of values for and .
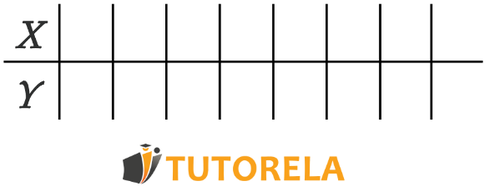
Now we fill in the table. To fill it, we select any number we want for the value of , and for we'll get a solution for the value of .
It is advisable to use small numbers to facilitate the calculation.
For example, we put and we get , then we can put and we get .
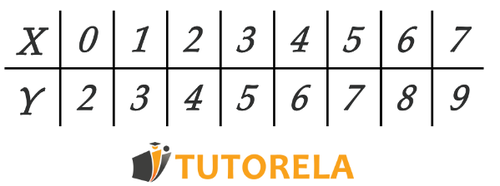
Now we want to draw a function from data
Using a data table.
To do this, we will draw the X-axis and the Y-axis.
Then we'll go over each pair of values in the table and plot them on the axes. Each pair of values we find represents a point on the graph. Let's start with the first value:
This can be briefly listed as follows:
It is located at . It looks like this:
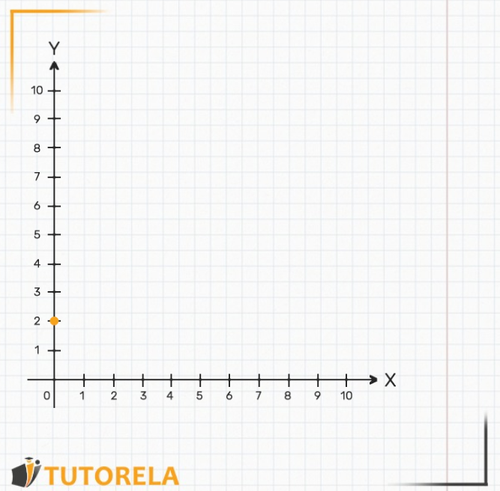
We'll move on to the next point:
Or in short
We will also mark it on the table.
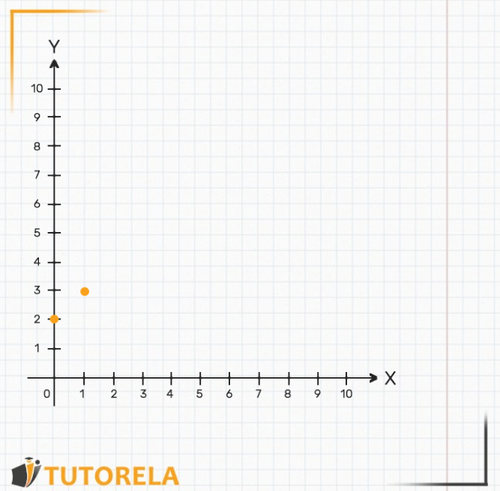
Similarly, we plot the rest of the other points we find using the graph.
It will look like this:
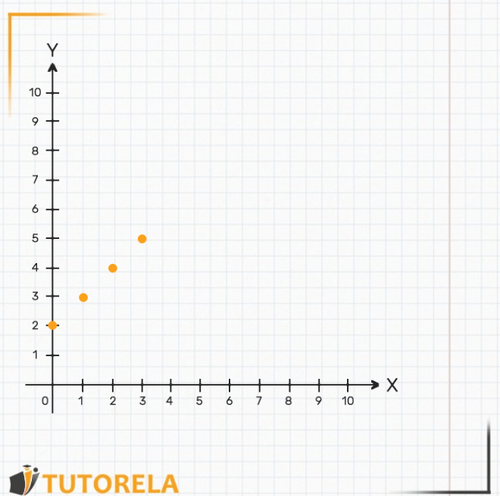
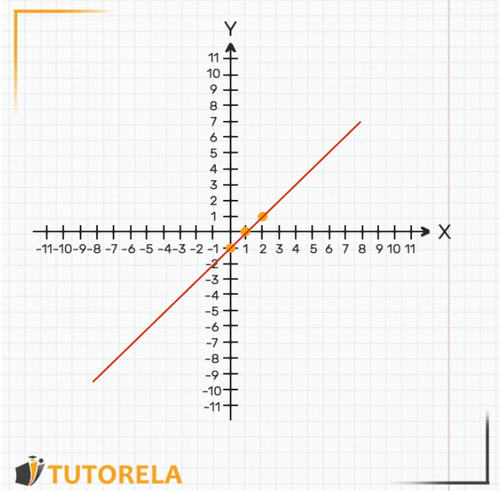
Now we can draw an imaginary line connecting all the points we've got:
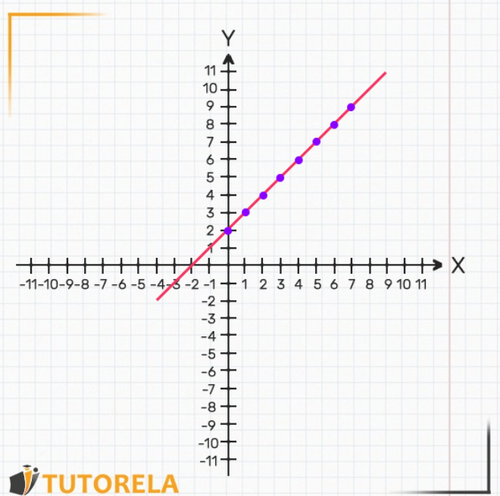
This is a drawing of the graph of the function.
Now let's look at an example of the reverse process. We'll try to understand from the table of values, which linear function it represents.
Look at the following table of values:
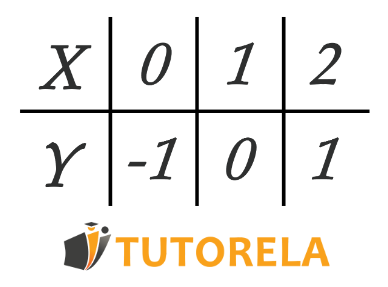
Next, you'll learn how to mathematically calculate what the linear equation is (that is, what the function is) that corresponds to these values. At this step, we can use our logic to deduce this on our own.
Note that for every value of , the corresponding value of is exactly times smaller.
Therefore, we can conclude that the straight line is
Now we want to plot this function, using the given table of values. Similar to the previous exercise, we will draw the two axes, and on top of them, we'll plot the points we obtained.
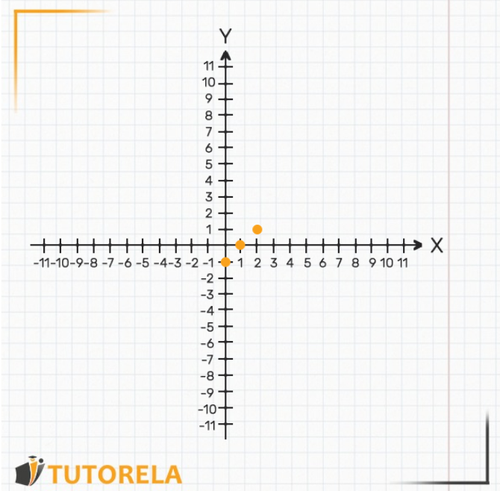
After marking the points, we'll draw the line between them, and this is the graph of the function. Note that it can be continued as much as we want on both sides. It is mandatory to draw with a ruler for greater precision.
Additional Example
Observe the following table:
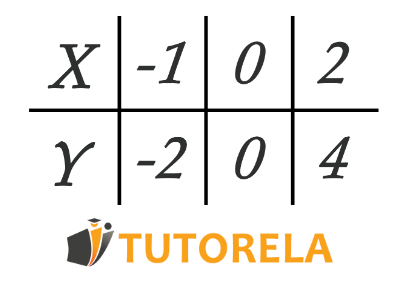
Next, we'll learn how to mathematically construct the corresponding graph from this table. In this step, we can deduce once again from our logic what the equation is that fits the data table. We will try to show what the relationship between and is. Note that for each pair , , the value of is exactly times that of .
Therefore, we can conclude that the appropriate equation is
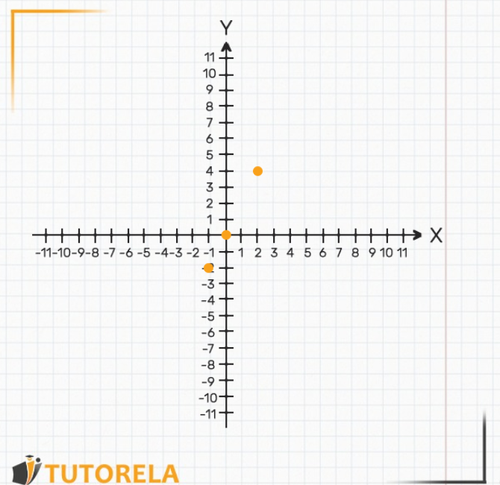
Now we want to plot this straight graph, using the data table. As in previous occasions, we'll mark all the points we received on the axes:
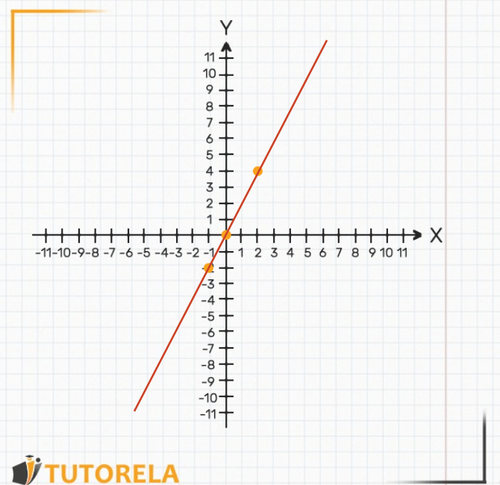
Now we'll draw the straight line that goes through the points with a ruler.
This is our straight graph.
Examples and Exercises with Solutions for Value Tables
Exercise #1
Find a y when
Video Solution
Step-by-Step Solution
To solve this problem, we'll follow these steps:
- Step 1: Identify the given equation .
- Step 2: Substitute the value into the equation.
- Step 3: Calculate the value of .
Now, let's work through each step:
Step 1: We start with the equation .
Step 2: Substitute into this equation:
.
Step 3: Perform the multiplication:
.
Therefore, the solution to the problem is .
Answer
10
Exercise #2
Calculate y given that and .
Video Solution
Step-by-Step Solution
We are given the equation y=x
We are also given the value of x,
x=2
Therefore, we will insert the given value into the equation
y=2
And that's the solution!
Answer
Exercise #3
Find a y when x=2
Video Solution
Step-by-Step Solution
To solve this problem, we will follow these steps:
- Step 1: Substitute the given value of into the equation.
- Step 2: Perform the calculations to find .
Now, let's work through each step:
Step 1: The equation provided is . We need to find the value of when .
Step 2: Substitute into the equation:
Simplifying this expression gives:
Therefore,
.
The calculated value of is .
Answer
Exercise #4
Find a y when x=2
Video Solution
Step-by-Step Solution
To solve the problem, we will follow these steps:
Step 1: Substitute the given value of into the equation .
Step 2: Simplify the expression to find the corresponding value of .
Now, let's apply these steps:
Step 1: Given the equation , we substitute :
Step 2: Simplify the expression:
Thus, the value of when is .
Therefore, the solution to the problem is .
Answer
Exercise #5
Calculate y given that and .
Video Solution
Step-by-Step Solution
To solve this problem, we will follow these steps:
Step 1: Identify the given information
Step 2: Apply the formula
Step 3: Perform the calculation
Now, let's work through each step:
Step 1: The problem gives us that and the relationship between and is .
Step 2: We will use the formula .
Step 3: Substituting into the formula, we get .
The calculation is as follows:
.
Therefore, the solution to the problem is .
Answer
1.6
Calculate y given that \( x=2 \) and \( y=x \).
Find a y when x=2
\( y=\frac{1}{2}x \)
Find a y when x=2
\( y=x-8 \)
- Inequalities
- Inequalities with Absolute Value
- Coordinate System
- Ordered pair
- Graphs
- Reading Graphs
- Discrete graph
- Continuous Graph
- Absolute Value Inequalities
- Function
- Linear Function
- Graphs of Direct Proportionality Functions
- Slope in the Function y=mx
- The Linear Function y=mx+b
- Finding a Linear Equation
- Positive and Negativity of a Linear Function
- Representation of Phenomena Using Linear Functions


