Decreasing function

What is a Decreasing Function?

A decreasing function is a type of relationship where, as you move to the right on the graph (increasing the xxx-value), the yy-value gets smaller. It’s like going downhill—the farther you go (the more you increase xx), the lower your height (the yy-value) becomes.

We will say that a function is decreasing when, as the value of the independent variable X X increases, the value of the function Y Y decreases.

How to Spot a Decreasing Function:

  1. On a Graph: The line or curve goes downward as you move from left to right.
  2. In Numbers: For any two xx-values, if the second number is larger than the first \(x_2 > x_1\​), then the second yy-value will be smaller than the first f(x2)<f(x1)f(x_2) < f(x_1).

Real-Life Example:

Think about eating a stack of cookies. Every time you eat one, the number of cookies left in the stack gets smaller. That’s a decreasing function—your yy-value (cookies left) decreases as your xx-value (number of cookies eaten) increases.

Fun Fact:

If the line or curve always goes down without stopping, it's called strictly decreasing. If it flattens for a bit before going down again, it’s just decreasing.

Let's see an example of strictly decreasing linear function on a graph:
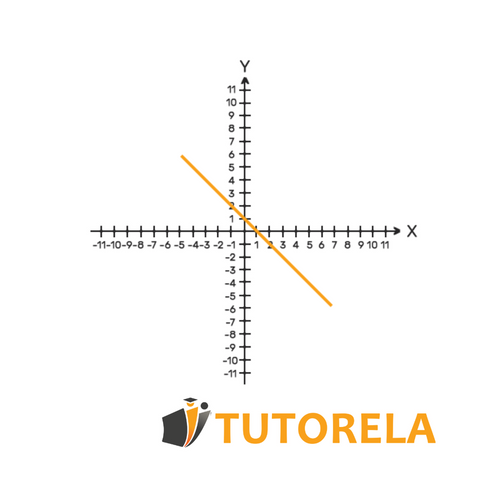
Decreasing function

Suggested Topics to Practice in Advance

  1. Ways to Represent a Function
  2. Representing a Function Verbally and with Tables
  3. Graphical Representation of a Function
  4. Algebraic Representation of a Function
  5. Notation of a Function
  6. Rate of Change of a Function
  7. Variation of a Function
  8. Rate of change represented with steps in the graph of the function
  9. Rate of change of a function represented graphically
  10. Constant Rate of Change
  11. Variable Rate of Change
  12. Rate of Change of a Function Represented by a Table of Values

Practice Decreasing function

Examples with solutions for Decreasing function

Exercise #1

In what domain does the function increase?

–20–20–20–10–10–10101010202020–10–10–10101010000

Video Solution

Step-by-Step Solution

Let's remember that the function increases if the x x values and y y values increase simultaneously.

On the other hand, the function decreases if the x x values increase while the y y values decrease simultaneously.

In the given graph, we can see that the function increases in the domain where x > 0 ; in other words, where the y y values are increasing.

Answer

x > 0

Exercise #2

Determine in which domain the function is negative?

–0.5–0.5–0.50.50.50.51111.51.51.5222000

Video Solution

Step-by-Step Solution

Remember that a function is increasing if both X values and Y values are increasing simultaneously.

A function is decreasing if X values are increasing while Y values are decreasing simultaneously.

In the graph, we can observe that in the domain x > 1 the function is decreasing, meaning the Y values are decreasing.

Answer

x > 1

Exercise #3

In what domain is the function increasing?

–5–5–5555101010151515–5–5–5555000

Video Solution

Step-by-Step Solution

Let's first remember that a function is increasing if both the X and Y values are increasing simultaneously.

Conversely, a function is decreasing if the X values are increasing while the Y values are decreasing simultaneously.

In the graph shown, we can see that the function is increasing in every domain and therefore the function is increasing for all values of X.

Answer

All values of x x

Exercise #4

In what domain does the function increase?

000

Video Solution

Step-by-Step Solution

Let's remember that the function increases if the X values and Y values increase simultaneously.

On the other hand, the function decreases if the X values increase and the Y values decrease simultaneously.

In the given graph, we notice that the function increases in the domain where x < 0 , meaning the Y values are increasing.

Answer

x<0

Exercise #5

In what interval is the function increasing?

Purple line: x=0.6 x=0.6

111222333111000

Video Solution

Step-by-Step Solution

Let's remember that a function is described as increasing if both X values and Y values are increasing simultaneously.

A function is decreasing if X values are increasing while Y values are decreasing simultaneously.

In the graph, we can see that in the domain x < 0.6 the function is increasing, meaning the Y values are increasing.

Answer

x<0.6

Exercise #6

Does the function in the graph decrease throughout?

YYYXXX

Step-by-Step Solution

To solve this problem, we'll begin by examining the graph of the function provided:

  • Step 1: Observe the graph from left to right along the x-axis.
  • Step 2: Look for any intervals where the function value (y-coordinate) does not decrease as the x-value increases.
  • Step 3: Pay special attention to segments where the graph might look horizontal or rising.

Upon inspecting the graph, we find:

- There are sections where the function's y-values appear to remain constant or potentially rise as the x-values increase. Specifically, even if the function decreases in major portions, any interval where it doesn't means the function cannot be classified as decreasing throughout.

Thus, the function does not strictly decrease on the entire interval shown. Therefore, the solution to the problem is No.

Answer

No

Exercise #7

Is the function in the graph decreasing? yx

Step-by-Step Solution

To solve this problem, we'll follow these steps:

  • Step 1: Verify the graph's overall path direction
  • Step 2: Confirm if the y-values are decreasing as we proceed from the left side of the graph to the right side (increasing x-values).

Now, let's work through each step:

Step 1: By examining the graph, the red line starts at a higher point on the y-axis and moves downward to a lower point as it moves horizontally across the x-axis from left to right.

Step 2: Since for every point, the red line descends as it progresses from the leftmost point to the rightmost, this indicates a consistent decrease in the y-values.

Therefore, the solution to the problem is Yes, the function in the graph is decreasing.

Answer

Yes

Exercise #8

Is the function shown in the graph below decreasing?

yx

Step-by-Step Solution

The graph presented is a straight line. To determine whether the function is decreasing, we need to examine the slope of this line.

The line has a negative slope, as it moves downward from left to right. A function is considered decreasing when its slope is negative.

In formal terms, for a linear function expressed as y=mx+c y = mx + c , if the slope m m is negative, the function is decreasing over its entire domain.

From the graph, it's evident that the line has a negative slope, thus indicating that the function is indeed decreasing.

Therefore, the answer to the problem is Yes.

Answer

Yes

Exercise #9

Is the function in the graph decreasing?

yx

Step-by-Step Solution

To analyze whether the function in the graph is decreasing, we must understand how the function's behavior is defined by its graph:

  • Step 1: Examine the graph. The graph presented is a horizontal line.
  • Step 2: Recognize the properties of a horizontal line. Horizontally aligned lines correspond to constant functions because the y y -value remains the same for all x x -values.
  • Step 3: Define the criteria for a function to be decreasing. A function decreases when, as x x increases, the value of f(x) f(x) decreases.
  • Step 4: Apply this criterion to the horizontal line. Since the y y -value is constant and does not decrease as x x moves rightward, the function is not decreasing.

Therefore, the function represented by the graph is not decreasing.

Answer

No

Exercise #10

Is the function shown in the graph below decreasing?

yx

Step-by-Step Solution

To solve this problem, we'll follow these steps:

  • Step 1: Visually inspect the graph to see if it is consistently sloping downward.
  • Step 2: Apply the definition of a decreasing function.

Now, let's work through each step:
Step 1: Observing the graph, the function's graph is a line moving from the top left to the bottom right. This indicates it slopes downward as we move from left to right across the x x -axis.
Step 2: According to the definition of a decreasing function, for any x1<x2 x_1 < x_2 , it must hold true that f(x1)>f(x2) f(x_1) > f(x_2) . Since the graph shows a line moving downward, this condition is satisfied throughout its domain.

Therefore, the function represented by the graph is indeed decreasing.

The final answer is Yes.

Answer

Yes

Exercise #11

In which domain does the function increase?

Green line:
x=0.8 x=-0.8

–2–2–2222222000

Video Solution

Step-by-Step Solution

The function increases if X values and Y values increase simultaneously.
In this function, despite its unusual form, we can observe that the function continues to increase according to the definition at all times,
Furthermore there is no stage where the function decreases.
Therefore, we can say that the function increases for all X, there is no X we can input where the function will be decreasing.

Answer

All values of x x

Exercise #12

In which interval does the function decrease?

Red line: x=0.65 x=0.65

111222333–1–1–1111000

Video Solution

Step-by-Step Solution

Remember that a function is increasing if both the x x values and the y y values are increasing simultaneously.

A function is decreasing if the x x values are increasing while the y y values are decreasing simultaneously.

In the graph we can see that the function is decreasing in all domains. In other words, it is decreasing for all x x .

Answer

All values of x x

Exercise #13

In what domain does the function increase?

Black line: x=1.1 x=1.1

–2–2–2222444666222000

Video Solution

Step-by-Step Solution

Remember that a function is increasing if the x x values and y y values are increasing simultaneously.

A function is decreasing if the X values are increasing and the Y values are decreasing simultaneously.

In the plotted graph, we can see that in the domain 1.1 > x > 0 the function is increasing—meaning the y y values are increasing.

Answer

1.1 > x > 0

Exercise #14

Determine the domain of the following function:

The function describes a student's grades throughout the year.

Step-by-Step Solution

According to logic, the student's grades throughout the year depend on many criteria that are not given to us.

Therefore, the appropriate domain for the function is - it is impossible to know.

Answer

Impossible to know.

Exercise #15

Which domain corresponds to the described function:

The function represents the velocity of a stone after being dropped from a great height as a function of time.

Step-by-Step Solution

According to logic, the speed of the stone during a fall from a great height will increase as it falls with acceleration.

In other words, the speed of the stone increases, so the appropriate domain for this function is - always increasing.

Answer

Always increasing