The Linear Function y=mx+b

🏆Practice linear function y=mx+b

The linear function y=mx+by=mx+b actually represents a graph of a straight line that has a point of intersection with the vertical Y Y axis.

m m represents the slope.
When m m is positive, the slope is positive: the line goes upwards.
When m m is negative, the slope is negative: the line goes downwards.
When m=0 m = 0 , the slope is zero: the line is parallel to the X X axis.

b b represents the point where the line intersects the Y Y axis.
If b=0 b=0 , then the line will pass through the origin of the coordinates, that is, the point (0,0) \left(0,0\right)

La función lineal
Start practice

Test yourself on linear function y=mx+b!

einstein

For the function in front of you, the slope is?

XY

Practice more now

How do we know if a point lies on a function?

If we are given a point, we can place it into the equation of a line to see if the equation holds true.
If we are given just one part of the point: X X or Y Y , we will put the given value into the equation correctly and find the second part of the point.


How do we graph the function?

If we want a precise drawing, we'll build a table of values with 3 3 or fewer values.
We replace X X each time and obtain the value of Y Y .
We consider the slope of the function to be increasing, decreasing, or equal to 0 0 , and then we graph it.


Join Over 30,000 Students Excelling in Math!
Endless Practice, Expert Guidance - Elevate Your Math Skills Today
Test your knowledge

What do we do if the slope is undefined?

To calculate the slope, we can use a formula that finds it using two given points that the line passes through:

m=(Y2Y1)(X2X1) m=\frac{\left(Y2-Y1\right)}{(X2-X1)}


A Lesson on Linear Functions

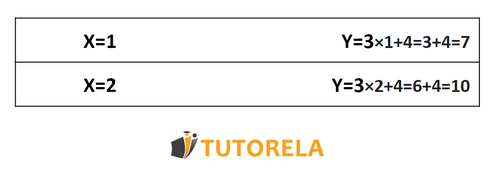
We are given a linear function y=3x+4 y=3x+4 .

We are asked to interpret the values 3 3 and 4 4 and plot the graph of the function.

First, it appears that m=3 m=3 , meaning 3 3 represents the slope of the line (or function).

b=4 b=4 means that the line intersects the vertical axis (the y-axis) at 4 4 .

To plot the graph, all we need are 2 2 points.
We substitute values and obtain:

1.a - An exercise on the linear function

Now we will mark the two points on the coordinate system and connect them.
Looking at the graph, we can confirm that the plot intersects the y-axis at the value of 4 4 .


Examples and exercises with solutions for the linear function

examples.example_title

Find the slope of the line that passes through the points (4,1),(2,5) (4,1),(2,5)

examples.explanation_title

Remember the formula to calculate the slope using the points:

Now, replace the data in the formula:

(51)(24)=42=2 \frac{(5-1)}{(2-4)}=\frac{4}{-2}=-2

examples.solution_title

2-

Do you know what the answer is?
Start practice