Solution with graphical method for linear equations with two variables

🏆Practice graphical solution

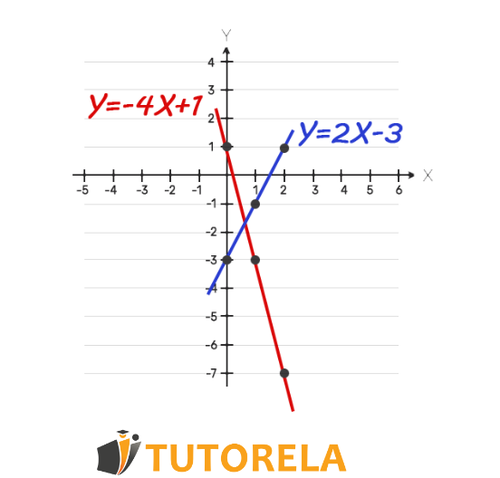
To solve with the graphical method linear equations that have two unknowns we must correctly draw the two graphs on the Cartesian plane and find their point of intersection.

How do we do it?

  • We will consider each equation as if it were a function and we will make a table of values of X X and Y Y .
  • We will place in the X X of each equation random values (we recommend to put 0,1,2 0,1,2 ), then we will deduce the Y Y corresponding to each X X and we will write it down respectively in the table of values.
  • We will draw a Cartesian plane and mark on it the points of each function.
  • After we have marked all the points of a function we will draw a line between them and see how the function looks like.
  • Only after this we will start marking the points of the second function to avoid confusion, then we will redraw a line between these last points.
  • We will analyze what is the point of intersection between the graphs we drew, this point represents the solution graphically for your system of linear equations.

Note that you might see a case in which the lines are parallel and, therefore, there are no points of intersection between them or a case in which the lines overlap and, thus, there would be infinite points of intersection.
Start practice

Test yourself on graphical solution!

einstein

Which graph corresponds to the following equations?

\( 3(2x-4y)=12 \)\( \)

\( \frac{x+y}{3}-\frac{y}{3}=7 \)

Practice more now

Example

y=2x3y=2x-3

I'm sorry, but you didn't provide any content for translation. Could you please provide the text you need translated?X
-30
-1I'm sorry, but you haven't provided any text or HTML content for translation. Could you please provide the content you need translated from Spanish to English?
I'm sorry, but you haven't provided any content for translation. Could you please provide the text or HTML content you need translated from Spanish to English?I'm sorry, but you haven't provided any content for translation. Could you please provide the text or HTML content you need translated from Spanish to English?

y=4x+1y=-4x+1

I'm sorry, but you didn't provide any content for translation. Could you please provide the text or HTML content you need translated from Spanish to English?I'm sorry, but you didn't provide any content for translation. Could you please provide the text or HTML content that you need translated from Spanish to English?
I'm sorry, but you didn't provide any specific text or HTML content to translate. Could you please provide the content you need translated from Spanish to English?0
-3I'm sorry, but you didn't provide any specific text or HTML content to translate. Could you please provide the text or HTML content that needs to be translated from Spanish to English?
-72

Graphic Method for a system of linear equations with two variables

A4 - Equality of coefficients when the coefficients are identical in some of the variables


Examples and exercises with solutions using the graphical method for a system of linear equations with two variables

Exercise #1

Which graph corresponds to the following equations?

3(2x4y)=12 3(2x-4y)=12

x+y3y3=7 \frac{x+y}{3}-\frac{y}{3}=7

Video Solution

Answer

Join Over 30,000 Students Excelling in Math!
Endless Practice, Expert Guidance - Elevate Your Math Skills Today
Test your knowledge
Start practice