The function
the most basic quadratic function:
the most basic quadratic function:

The family of parabolas
The basic quadratic function – with the addition of
In this family, we are given a quadratic function that clearly shows us how the function moves horizontally – how many steps it needs to move right or left.
represents the number of steps the function will move horizontally – right or left.
If is positive – (there is a minus in the equation) – the function will move steps to the right.
If is negative – (and as a result, there is a plus in the equation because minus times minus equals plus) – the function will move steps to the left.
In this quadratic function, we can see a combination of horizontal and vertical shifts:
: Determines the number of steps and the direction the function will move vertically – up or down.
positive – shift up, negative – shift down.
: Determines the number of steps and the direction the function will move horizontally – right or left.
One function
\( y=-2x^2-3 \)
to the corresponding graph:
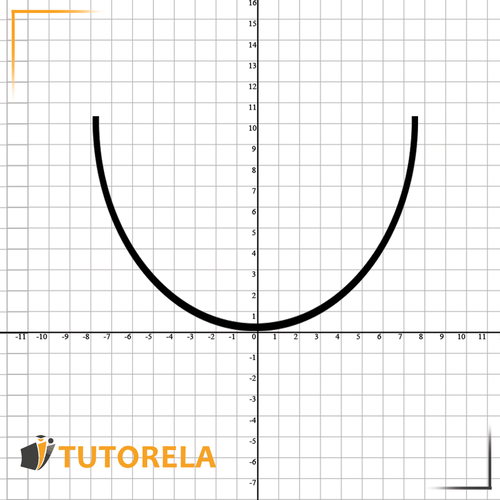
Meet the most basic quadratic function:
In this function:

The function is a smiling minimum function and its vertex is -
The axis of symmetry of this function is .
The increasing interval of the function – all the values where the function is increasing are:
The decreasing interval of the function – all the values where the function is decreasing are:
Positive interval: all except – you can see in the graph that the entire function is above the axis
Negative interval: none. The entire function is above the axis.
Let's continue to a similar function from the same family:
In this function:
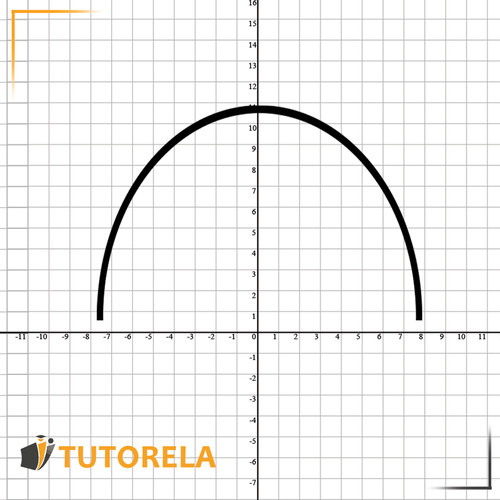
The function is a sad maximum function and its vertex is
The axis of symmetry of this function is .
Increasing interval:
Decreasing interval:
Positive interval: None. The entire function is below the axis.
Negative interval: All except
Let's continue with another function from the same family:
In this function:
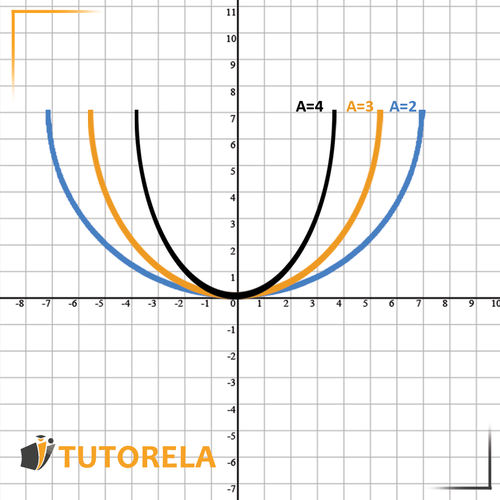
Its vertex is-
The axis of symmetry of this function is .
The larger is: the parabola will have a smaller opening – closer to its axis of symmetry.
The smaller is: the parabola will have a larger opening – farther from its axis of symmetry.
The function from this family has no horizontal or vertical shift because in every function from this family the vertex is
The family of parabolas
The basic quadratic function – with the addition of
In this function:
– represents the intersection point of the function with the axis.
The meaning of is a vertical shift up or down of the function from the vertex .
If is positive – the function will shift vertically up by the number of steps indicated by .
If is negative – the function will shift vertically down by the number of steps indicated by .
This function describes only vertical shifts up and down according to
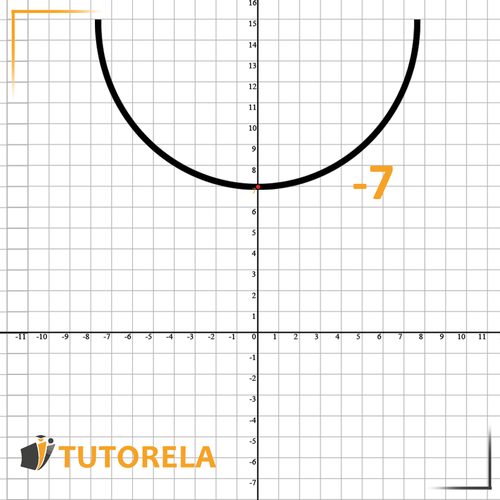
Let's see an example:
In this function -
this means that the intersection point of the function with the axis is .
And actually – the function moves vertically steps up.
In this family, we are given a quadratic function that clearly shows us how the function moves horizontally – how many steps it needs to move right or left.
represents the number of steps the function will move horizontally – right or left.
If is positive – (there is a minus in the equation) – the function will move steps to the right.
If is negative – (and as a result, there is a plus in the equation because minus times minus equals plus) – the function will move steps to the left.
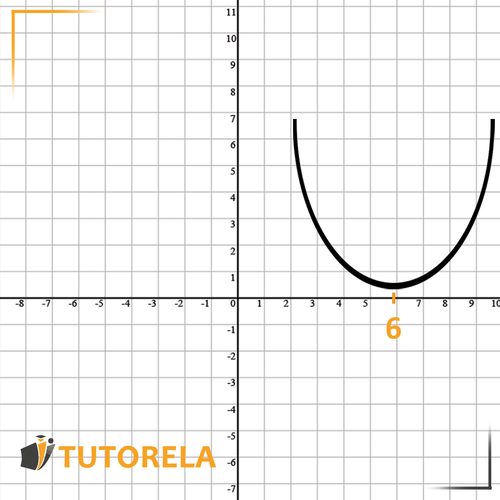
Let's see an example:
This function moves from the vertex , steps to the right
Let's see this in the figure:
In this quadratic function, we can see a combination of horizontal and vertical shifts:
: Determines the number of steps and the direction the function will move vertically – up or down.
positive – shift up, negative – shift down.
: Determines the number of steps and the direction the function will move horizontally – right or left.
Let's look at an example of combining two translations together:
For example, in the function:
The changes will be:
According to : the parabola will move steps to the left.
According to : the parabola will move steps up.
Let's see this in the illustration:
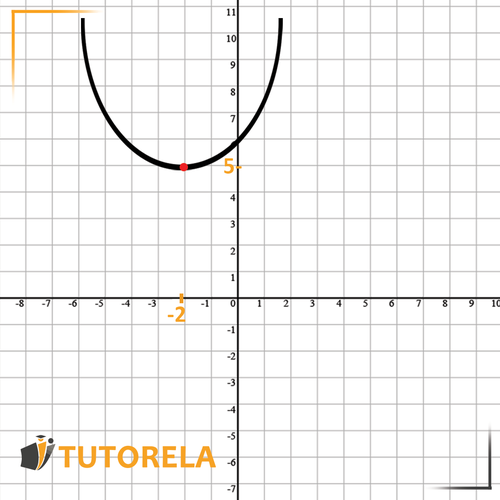
We can see that the vertex of the parabola is:
One function
\( y=-6x^2 \)
to the corresponding graph:
Which chart represents the function \( y=x^2-9 \)?
One function
\( y=6x^2 \)
to the corresponding graph:
One function
to the corresponding graph:
To solve this problem, we'll match the given function with its corresponding graph based on specific characteristics:
Given these observations, we analyze each graphical option:
Therefore, the function matches with graph option 4.
4
One function
to the corresponding graph:
To solve this problem, we need to match the function with its graph. This function represents a downward-opening parabola with the vertex at the origin . The coefficient is negative, confirming it opens downwards, and its large absolute value indicates that the parabola closes towards the axis more sharply than a standard curve.
Let's identify the characteristics of :
- The graph is a parabola, opening downwards.
- The vertex is at the origin, .
- Symmetric around the y-axis.
- Its steepness is greater than the standard parabola due to the coefficient .
By analyzing the given graph options, the graph marked as 4 aligns perfectly with these properties: It is centered on the origin, opens downwards, and has an evident steep slope.
Therefore, the correct graph that matches the function is option 4.
4
Which chart represents the function ?
To solve the problem of identifying which chart represents the function , let's analyze the function and its graph:
After inspecting the charts:
Therefore, the chart that represents the function is Choice 4.
4
One function
to the corresponding graph:
The function given is . This is a quadratic function, a type of parabola with vertex at the origin (0,0), because there are no additional terms indicating a horizontal or vertical shift.
First, note the coefficient of is . A positive coefficient indicates that the parabola opens upwards. The value of means the parabola is relatively narrow, as it is stretched vertically compared to the standard .
To identify the corresponding graph:
Upon examining each graph, you find that option 2 shows a parabola that is narrower than the standard parabola and opens upwards distinctly, matching our function .
Therefore, the correct graph for the function is option 2.
2
Find the intersection of the function
With the X
To solve this problem, we'll find the intersection of the function with the x-axis. The x-axis is characterized by . Hence, we set and solve for .
Let's follow these steps:
Taking the square root of both sides gives .
Adding 2 to both sides results in .
The x-coordinate is , and since it intersects the x-axis, the y-coordinate is .
Therefore, the intersection point of the function with the x-axis is .
The correct choice from the provided options is .